
In this Market?
The advice everyone gives comes with a price tag nobody checks.

If you ever tell people that you buy individual stocks, at some point someone will inevitably say something like the following: ‘Just buy the S&P 500 – you can’t beat it.’
It’s true that the index is notoriously difficult to beat by fund managers, and for good reason. Indexes that cover the S&P 500 track the stock performance of 500 of the largest publicly traded companies in the US. Not only are the tech companies leading the market able to get exceptional returns on capital, but the index is big enough to cover a broad diversification of industries.
It’s also true that since the index was created, the price has always recovered from every dip. Meaning that it always goes up and to the right over the long term – inflation and regular index updates help to ensure that. Underperforming companies are removed and replaced with stronger ones, ensuring the index consistently reflects holdings that are continually profitable.
However, many retail investors take the strength of the index to mean it’s essentially risk-free. While the index has delivered substantial gains over long periods, it has also experienced “lost decades” where returns were stagnant for long periods.
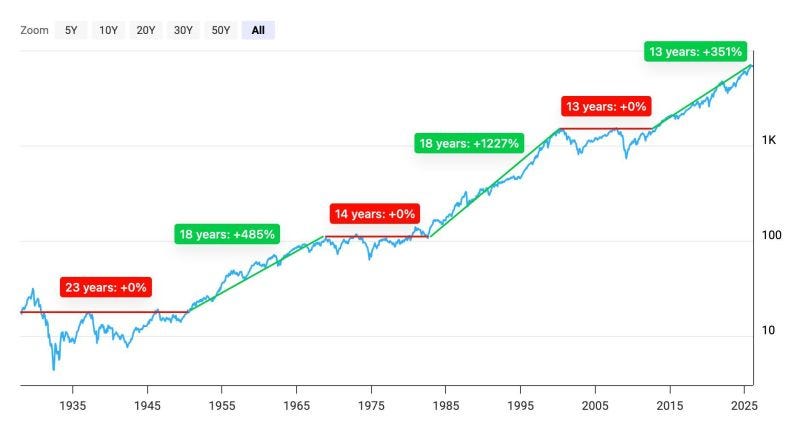
If you had invested in the S&P 500 at its peak in 1968, it would have taken until 1982—a span of 14 years—to recover your initial investment when adjusted for inflation. Similarly, after the market peak in 2000, the S&P 500 took approximately 13 years to regain its previous highs1.
Investors buying the Nasdaq 100 or a market cap-weighted S&P 500 fund should understand that they are making a big bet on emerging technologies – particularly AI. New technologies are always reshaping the way the world operates, and artificial intelligence is clearly… doing exactly that.
The problem, in this market, is that all the optimistic outcomes are already reflected in current prices.
Some estimates of the S&P 500 average price to earnings ratio are as high as ~32, roughly 80–85% above the long-term median of ~18.
The Price to Book and Price to Sales are both at their peaks over the past 25 years.
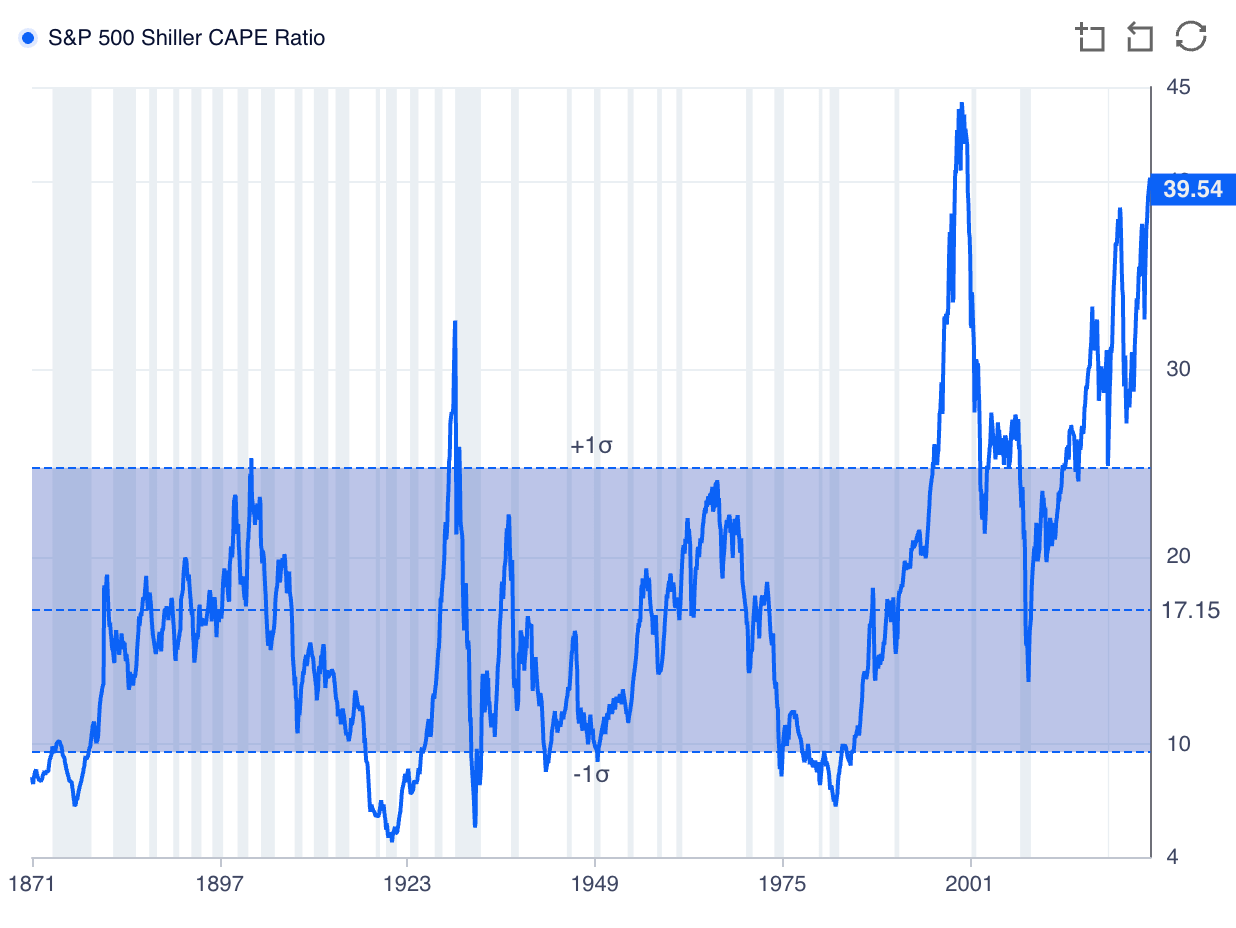
Most interestingly, the Shiller ratio (also known as cyclically adjusted price-to-earnings, or CAPE) for the S&P 500 currently sits near 40 — against a historical median of 16. Looking at the CAPE historical chart, it’s worth noting that we haven’t just matched the peaks of 1929 and dot-com — valuations have never stayed this hot for this long.
This isn’t a call that the market will crash — it’s an observation that at today’s valuations we are being paid less to accept more risk.
High CAPE doesn’t predict the timing of a decline; it widens the range of bad outcomes and shrinks the reward for tolerating them. That’s not a forecast. It’s a probability assessment — and probability, not prophecy, is what a disciplined investor is supposed to price.
Market bulls are saying that the S&P 500 forward PE is only 21-25. But the word, “only,” is doing a lot of work here.
Forward-looking valuation metrics are inherently speculative compared with sales that have already hit the books. Analyst estimates are chronically optimistic, and most optimistic exactly at cycle peaks when margins are already at records. Simply put, forward P/E looks “cheap” only because the denominator has been pre-loaded with a large jump in earnings that hasn’t happened yet.
Even if multiple companies do simultaneously hit their earnings estimates without running into a black swan event, the new multiple will still be above the historical average.
So in order for investors to get paid appropriately for holding the hotly valued companies, earnings would have to exceed the already optimistic expectations.
The index’s flat decades weren’t random—they reflected a combination of high valuations, economic stagnation, and macroeconomic shocks. During the 1970s, stagflation and oil crises weighed on returns, while the 2000s saw the bursting of the dot-com bubble and the financial crisis.
The last bear market was 2022. The last recession was 2008. Part of what’s driven the euphoria since is not just AI optimism or low rates — it’s the mechanics of how Americans now invest. When Vanguard founder John Bogle launched the first index fund in the 1970s, his “buy the market and hold forever” philosophy was sound when almost no one was doing it. He said, “Don’t look for the needle in the haystack. Just buy the haystack.” But back then the haystack was selling closer to 10 times earnings — not 40.
Markets take the stairs up and the elevator down.
This isn’t to say that the current bull run doesn’t have more runway left. But markets can move abruptly when valuations are stretched.
One disappointing guidance update and the dominoes can fall quickly. If one major company like Nvidia misses earnings or cuts guidance, the Magnificent Seven — which have been carrying the index — could reprice simultaneously.
Swing traders hit stops, triggering automated sell orders that accelerate the drop. Short sellers add gravity. Passive funds have no mechanism to respond — they don’t sell selectively, they just hold until the same investors who bought at the top, sell at the bottom because they had no idea what they owned in the first place.
Of course, some Boglehead purists may argue that simply holding the index through inevitable corrections will still yield good results long term. But given the historical examples cited in this article, one may have to decide how “long” is “long-term.”
When Benjamin Graham defined investment vs. speculation, he said, “An investment operation is one which, upon thorough analysis, promises safety of principal and an adequate return. Operations not meeting these requirements are speculative.”
While we can’t predict macroeconomic shocks, buying when valuations far exceed historical norms adds unnecessary risk. Even without buying individual stocks, there are indexes and entire industries selling within their historical valuation ranges that may have a better probability of offering adequate returns.
*Metrics used in this article reflect their assessment as of 7/6/2026. Linked metrics may not correspond with the numbers quoted in this article depending on when it’s read.
(on an inflation-adjusted basis)
Most people treat the S&P 500 like a risk-free savings account and completely forget about those 13-to-14-year "lost decades". When valuations are this bloated, you’re basically taking on massive risk for tiny rewards.
That’s exactly why I personally layer a covered call ETF on top of my index holdings.
It juices out a steady monthly cash payout to smooth out the ride if the market grinds sideways. Instead of panicking during a long downturn, I can just stack that extra cash on the sidelines and use it as a war chest to scoop up quality assets at a deep discount.